Have you ever stared at a prescription bottle, wondering why the pill inside looks completely different from the one your doctor originally prescribed? You are not alone. For decades, patients have hesitated to take generic medications because they simply look different or come in cheaper packaging. This skepticism costs the healthcare system billions and leaves many people with unnecessary anxiety about their treatment.
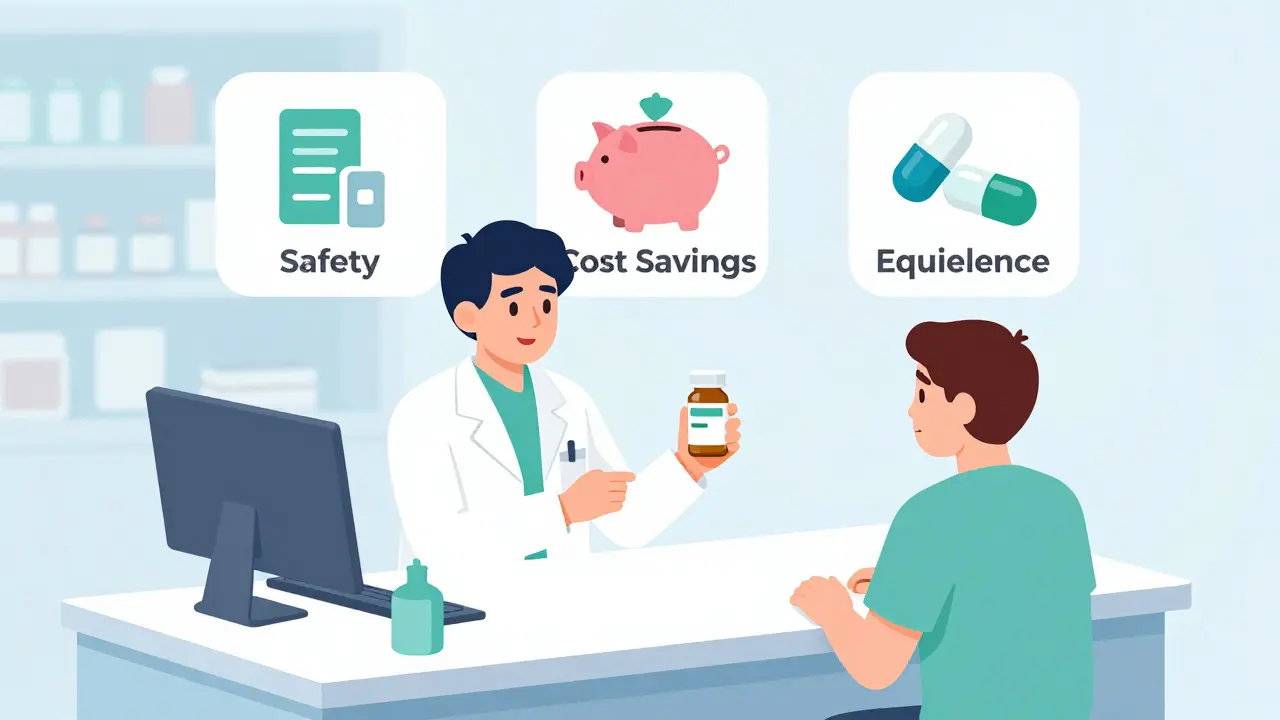
This is where infographics about generics are visual education tools designed to explain the science, safety, and cost benefits of generic medications through clear, accessible graphics. These resources bridge the gap between complex regulatory science and everyday patient understanding. They do more than just share facts; they build trust by visually demonstrating that generic drugs work exactly like brand-name versions.
The Power of Visuals in Medication Understanding
Text-heavy brochures often fail to stick. When patients leave a pharmacy counter overwhelmed by dense medical jargon, they rarely remember the key message: generic drugs are safe and effective. Visual communication changes this dynamic entirely. The U.S. Food and Drug Administration (FDA) recognized this shift early on. In 2017, following the reauthorization of the Generic Drug User Fee Amendments (GDUFA), the FDA launched a comprehensive initiative to create visual aids that demystify generic drugs.
Why does this matter so much? Because numbers tell a stark story. As of 2023, more than 90% of prescriptions filled in the United States are for generic drugs. Yet, a 2021 FDA study revealed that 43% of surveyed patients still expressed concerns about whether these medications would work as well as brand-name options. That is a significant gap between reality and perception. Infographics help close that gap by translating scientific equivalence into digestible visuals.
Consider the impact on costs. The Congressional Budget Office estimated that generic drugs saved the U.S. healthcare system $1.68 trillion between 2010 and 2019. By increasing patient acceptance of generics through better education, we preserve those savings while ensuring everyone gets the treatment they need. Visual tools make the abstract concept of "therapeutic equivalence" concrete and believable.
How FDA Infographics Are Built for Clarity
Not all infographics are created equal. The FDA’s approach to creating these educational materials is rigorous and standardized. Their goal is not just to inform but to ensure comprehension across diverse audiences. Each infographic undergoes strict testing before it reaches the public.
For instance, the FDA conducts patient comprehension testing with at least 30 diverse participants prior to final publication. According to their 2022 methodology report, these tests yield average comprehension scores of 87%. This means that nearly nine out of ten people understand the core concepts after viewing the material. To achieve this, the FDA targets an 8th-grade reading level, verified by Flesch-Kincaid readability tests, ensuring the language is simple without being condescending.
Accessibility is another cornerstone of their design strategy. The infographics meet WCAG 2.1 AA standards for high-contrast color schemes and include alt text for screen readers. This ensures that patients with visual impairments can also benefit from the information. Whether viewed on a smartphone in a waiting room or printed on a desk in a clinic, the format remains consistent and user-friendly.
| Title | File Size | Primary Focus | Target Audience |
|---|---|---|---|
| Facts About Generic Drugs | 239 KB | General overview of safety and efficacy | Patients and general public |
| What Makes a Generic the Same? | 431 KB | Bioequivalence and dissolution rates | Skeptical patients |
| Postmarketing Surveillance | 282 KB | Ongoing safety monitoring processes | Healthcare providers |
| Exclusivity and Generic Drugs | 469 KB | Patent expiration timelines | Policymakers and insurers |
Comparing Top Educational Resources
While the FDA leads the charge, other organizations contribute valuable resources to the landscape of patient education. Understanding the differences between these sources helps healthcare providers choose the right tool for specific scenarios.
The GTMRx Institute focuses heavily on Comprehensive Medication Management (CMM). Their infographics often include interactive digital elements, such as clickable sections linking to detailed case studies. This makes them excellent for clinical settings where providers want to dive deeper into complex medication regimens. However, they lack the multilingual breadth of the FDA. While the FDA offers 100% of its generic drug resources in Spanish (titled "Medicamentos Genéricos"), GTMRx provides only 30% in Spanish. This limits their utility in diverse communities.
Then there is BeMedWise, known for its "Your Medicine: Be Safe. Be Smart." series. These materials integrate well with patient medication logs and tracking tools, offering practical value for daily management. But when it comes specifically to generics, they fall short. Only three of their fifteen core infographics address generic drugs comprehensively. If your primary goal is to alleviate fears about generic substitution, BeMedWise may not be the best standalone resource.
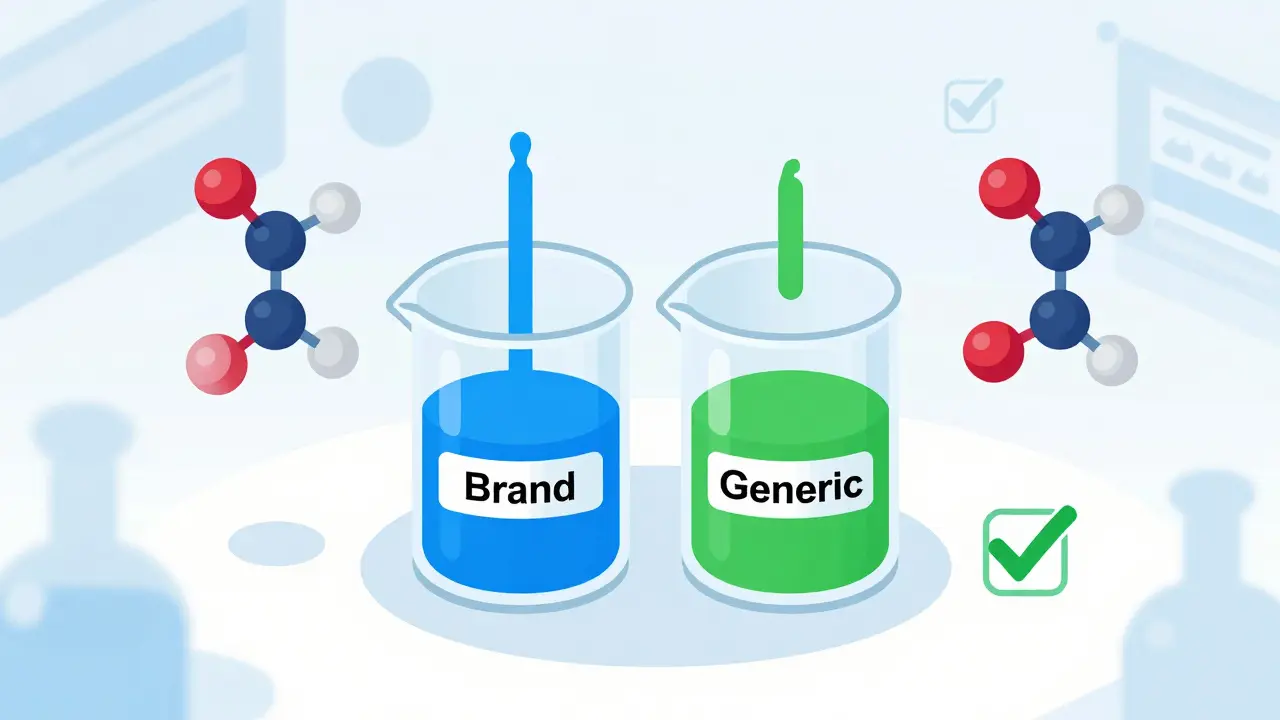
In terms of visualizing bioequivalence-the scientific proof that a generic works the same way as a brand-FDA materials currently outperform competitors. Independent research published in the *Journal of Health Communication* in 2021 found that 89% of test participants correctly interpreted the FDA’s comparative dissolution rate graphs. In contrast, only 67% accurately understood similar visuals from non-FDA sources. This precision matters when trying to convince a skeptical patient.
Expert Perspectives on Effectiveness
Do these visuals actually change behavior? Experts say yes, but with caveats. Dr. Janet Woodcock, former Director of the FDA Center for Drug Evaluation and Research, noted in a 2022 webinar that infographics increased patient understanding of generic drug equivalence by 40% compared to text-only materials. That is a substantial improvement in communication efficiency.
Dr. Bruce Lambert from the University of Illinois College of Applied Health Sciences added weight to this claim. His findings, published in *Patient Education and Counseling* in 2021, showed that patients who viewed FDA generic drug infographics were 3.2 times more likely to correctly identify key equivalence concepts than those receiving standard verbal counseling. For busy pharmacists, this means less time spent repeating the same explanations and more time addressing unique patient needs.
However, not all feedback is glowing. Dr. Aaron Kesselheim of Harvard Medical School raised a critical point in *JAMA Internal Medicine* (2022). He argued that current infographics oversimplify pharmacokinetic considerations for narrow therapeutic index (NTI) drugs. Medications like warfarin or levothyroxin require precise dosing, and small variations between manufacturers can matter. Standard infographics might inadvertently create a false sense of total equivalence for these specific cases. The Institute for Safe Medication Practices (ISMP) echoed this concern in their 2023 report, recommending that future visuals include specific indicators for drugs requiring pharmacist notification during substitution.
Real-World Implementation in Clinics
Theory is one thing; practice is another. How are these tools performing in actual healthcare settings? At Kaiser Permanente’s Southern California region, post-implementation surveys from Q3 2022 provided compelling data. Seventy-eight percent of pharmacists reported regularly using FDA generic drug infographics during consultations. More importantly, 63% said these tools reduced patient refusal of generic substitutions.
Pharmacists online share similar experiences. On Reddit’s r/pharmacy community, multiple professionals praised the "What Makes a Generic the Same as a Brand-Name Drug?" infographic. One top comment, receiving 142 upvotes, stated, "I've printed this and keep it behind the counter-it cuts counseling time in half for generic questions." This anecdotal evidence aligns with the quantitative data, suggesting a real-world reduction in friction during dispensing.
Digital integration is also growing. Epic Systems, a major electronic health record provider, added FDA generic drug infographics to their patient education module in Q4 2022. Within six months, these materials garnered 450,000 patient views. This seamless integration into existing workflows ensures that patients encounter the information at the moment of decision-making, rather than having to seek it out later.
Challenges and Future Directions
Despite their success, gaps remain. A 2022 analysis from the University of California, San Francisco, highlighted that most generic drug infographics underrepresent health equity considerations. Only the FDA's "Generic Drugs and Health Equity Handout" specifically addresses how generics reduce disparities in access for minority populations. This is crucial given that 34.7% of African American and 28.3% of Hispanic patients report higher concerns about generic quality compared to 22.1% of White patients, according to the Kaiser Family Foundation (2023).
Looking ahead, technology is set to enhance these tools further. The FDA released Version 2.0 of its "Generic Drug Facts" infographic in March 2023, updating cost savings data to reflect $313 billion in annual U.S. savings. Even more exciting is the planned integration of augmented reality (AR) features by Q2 2024. Prototypes demonstrated at the 2023 Digital Health Innovation Summit allow patients to scan medication bottles and view 3D molecular comparisons of brand and generic versions. This immersive experience could provide the definitive proof needed to silence lingering doubts.
As the market for pharmaceutical patient education grows-reaching $2.3 billion in 2022 with a 7.2% compound annual growth rate-we can expect even more sophisticated visual tools. The goal remains constant: empower patients with clear, accurate information so they can make confident decisions about their health.
Are generic drug infographics free to use?
Yes, the FDA provides all its generic drug infographics as free, downloadable PDF files. Healthcare providers and patients can access them directly from the FDA website without any licensing fees or restrictions.
Which infographic is best for explaining bioequivalence?
The FDA's "What Makes a Generic the Same as a Brand-Name Drug?" infographic is widely considered the most effective for explaining bioequivalence. It uses comparative dissolution rate graphs that have been validated to improve patient understanding significantly.
Do these infographics cover narrow therapeutic index drugs?
Current standard infographics generally simplify the topic and may not adequately address the complexities of narrow therapeutic index (NTI) drugs like warfarin. Experts recommend supplementing these visuals with specific pharmacist counseling for NTI medications.
Are there Spanish-language versions available?
Yes, the FDA offers 100% of its generic drug educational resources in Spanish under the title "Medicamentos Genéricos." Other providers like GTMRx offer limited Spanish translations, covering only about 30% of their materials.
How much money do generic drugs save annually?
According to updated 2023 data from the FDA, generic drugs save approximately $313 billion annually in the United States. Over the decade from 2010 to 2019, total savings reached $1.68 trillion, according to the Congressional Budget Office.